ML-Ch2-P1-End to End Machine Learning Project
[Machine Learning blog series](tags/Machine Learning)
Introduction
Welcome to this exciting chapter! In this blog, I’ll work through an end-to-end machine learning project, turning raw data into actionable insights and a working model. Follow these structured steps to tackle any ML problem confidently.
The Roadmap: Steps to Build a Machine Learning Project
Here’s are the main steps:
- Look at the Big Picture
- Get the Data
- Explore and Visualize the Data to Gain Insights
- Prepare the Data for Machine Learning Algorithms
- Select a Model and Train It
- Fine-Tune the Model
- Present the Solution
- Launch, Monitor, and Maintain the System
Working with Real Data
To work on real-world problems, you’ll need real data. Here’s where to find it:
Popular Open Data Repositories:
- OpenML.org
- Kaggle.com
- PapersWithCode.com
- UC Irvine Machine Learning Repository
- Amazon AWS Datasets
- TensorFlow Datasets
Meta Portals (they list open data repositories):
Other Pages Listing Popular Open Data Repositories:
Step 1: Look at the Big Picture
Task: Use California census data to build a model predicting housing prices in the state.
Data: The dataset includes metrics such as population, median income, and median housing prices for each block group in California.
Frame the Problem:
- Type: Supervised learning
- Goal: Regression task (multiple regression and univariate regression)
- Approach: Batch learning
Select a Performance Measure:
A common performance measure for regression problems is the Root Mean Square Error (RMSE):
$$
\text{RMSE}(\mathbf{X}, \mathit{h}) = \sqrt{\frac{1}{m} \sum_{i=1}^m \left(h(\mathbf{x}^{(i)}) - y^{(i)}\right)^2}
$$
Check the Assumptions
For example, what kind of machine learning system you would like your data to be fed into, a classification or regression system?
Step 2: Get the Data
1 | from pathlib import Path |
Question for myself:
The author mentions that there are 20,640 instances in the dataset. While this may seem small by machine learning standards, it’s perfect for getting started. How can we determine whether a dataset is “small” or not?
Get a feel of the type of the data!!!
- using methods
1 | housing = load_housing_data() |
1 | >>> housing["ocean_proximity"].value_counts() |
output:
1 | longitude latitude housing_median_age ... households median_income median_house_value |
- plotting histograms
1 | import matplotlib.pyplot as plt |

Figure 1: This figure shows the distribution of housing prices in California, with data grouped by region and income levels.
Create a test set
Creating a test set is theoretically simple; pick some instances randomly, typically 20% of the dataset (or less if your dataset is very large), and set them aside:
1 | def shuffle_and_split_data(data, test_ratio): |
then we can use the function to get the test set:
1 | >>> train_set, test_set = shuffle_and_split_data(housing, 0.2) |
the problem is: once we run the program again, it will generate a different test set. Over time, we will get to see the whole dataset.
solution:
- to save the test set on the first run and then load it in subsequent runs.
- to set the random number generator’s seed (using np.random.seed(42)) before calling np.random.permutation() so it always generates the same shuffled indices.
another problem comes: above solutions will break the next time we fetch an updated dataset.
solution: to have a stable train/test split even after updating the dataset, a common solution is to use each instance’s identifier to decide whether or not it should go in the test set. For example, to compute a hash of each instance’s identifier and put that instance in the test set if the hash is lower than or equal to 20% of the maximum hash value. This ensures that the test set will remain consistent across multiple runs, even if we refresh the dataset.
1 | from zlib import crc32 |
Scikit-Learn provides a few functions to split datasets into multiple subsets in various ways.
- The simplest function is train_test_split(), which does pretty much the same thing as the shuffle_and_split_data() function.
- there is a random_state parameter that allows us to set the random generator seed
- we can pass it multiple datasets with an identical number of rows, and it will split them on the same indices
1
2
3
from sklearn.model_selection import train_test_split
train_set, test_set = train_test_split(housing, test_size = 0.2, random_state=42)
How to avoid sampling bias?
- we should not have too many strata, and each stratum should be large enough
e.g. - some experts told us that the median income is a very important attribute to predict median housing prices
- then we want to ensure that the test set is representative of the various categories of incomes in the whole dataset
- so we try to categories the data
method 1:
1 | housing["income_cat"] = pd.cut(housing["median_income"], |
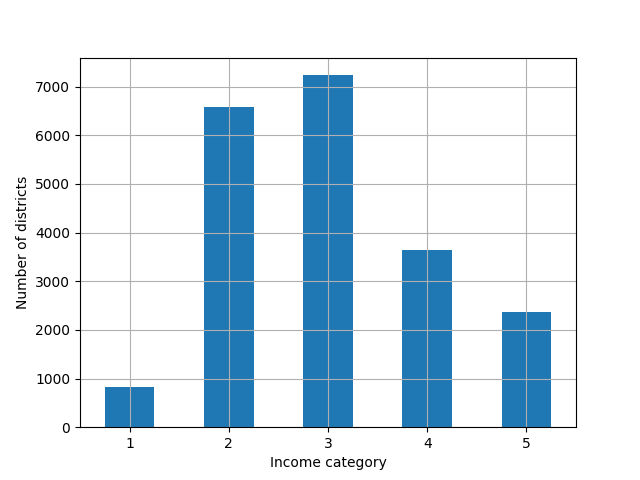
Figure 2: Histogram of income categories using pd.
method 2: using multiple splits
1 | from sklearn.model_selection import StratifiedShuffleSplit |
we can just the first split
1 | strat_train_set, strat_test_set = strat_splits[0] |
then
1 | >>> strat_test_set["income_cat"].value_counts() / len(strat_test_set) |
ML-Ch2-P1-End to End Machine Learning Project
https://emilypeng2017.github.io/2025/01/03/ML-Ch2-P1-End-to-End-Machine-Learning-Project/